Google Analytics for Beginners
Google Analytics can help you understand your audience, acquisition, and their behavior.
For those new to Google Analytics, it can be an overwhelming tool. Lots of great data, but you’re probably wondering what it means and what can you do with it? Fear not. As EVG’s Director of SEO, I spend a lot of my time working with Google Analytics. I’ve prepared this quick guide to the three main categories in Google Analytics you need to understand: Audience, Acquisition, and Behavior. If you’re a small business owner, this guide is designed for you!
Dashboard 101
Let’s start by opening up Google Analytics (If you haven’t set it up yet, here’s how). The first thing you’ll see is a dashboard that looks like this one.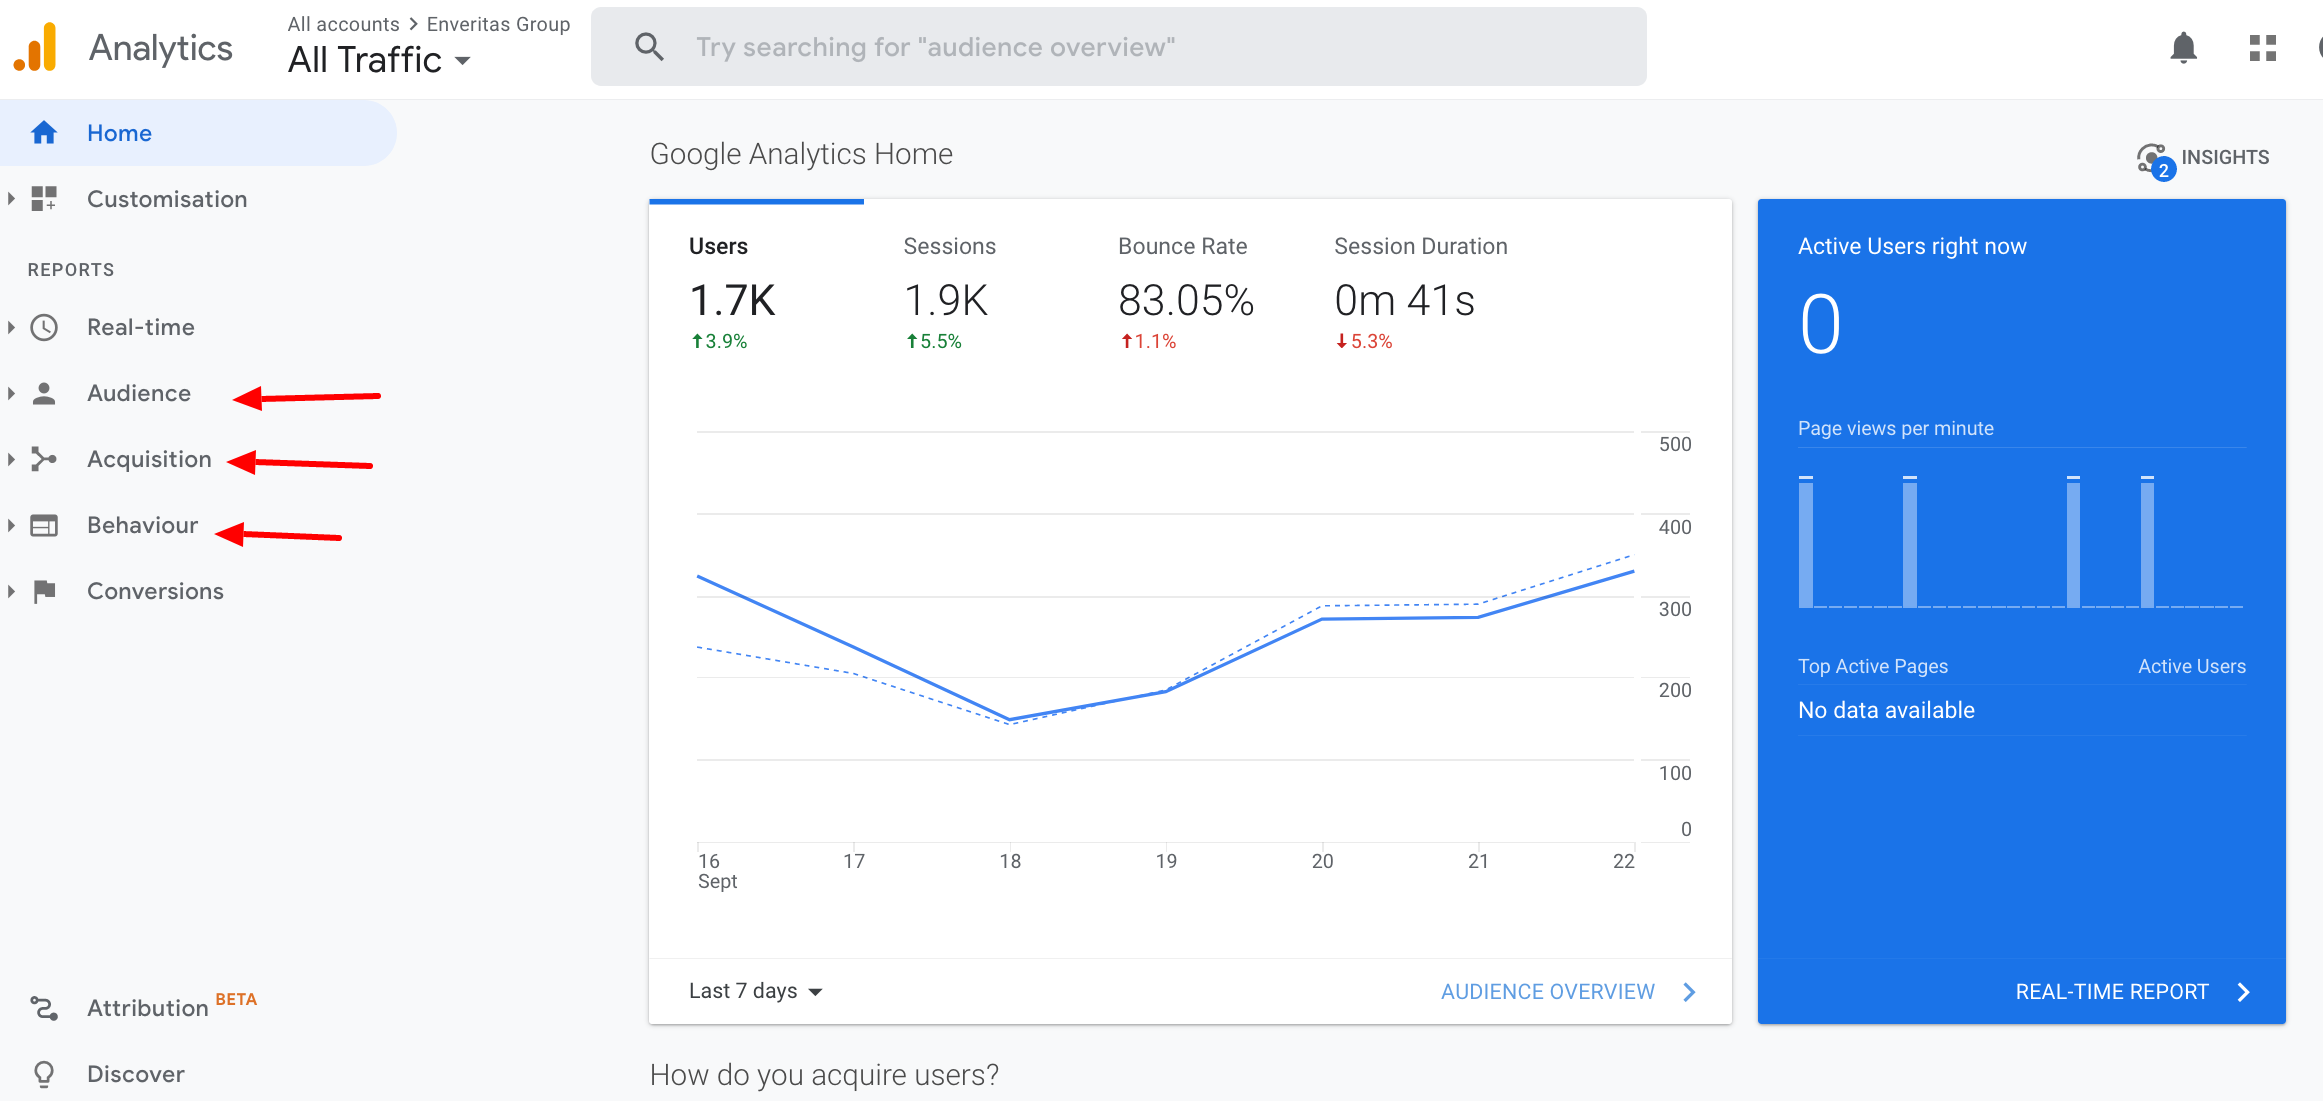
The arrows on the left in the screenshot above are pointing to the three key categories, Audience, Acquisition, and Behavior. Each is a link from the dashboard to the most important information about your website (unless you’ve set up conversions, which is a topic for another day). Let’s take a look at what these three categories cover and why they’re important.
Audience, Acquisition, and Behavior
Audience gives you information about your website visitors. Within this category, you’ll find information about:
- Their geographic location
- Their gender
- The type of device they use to visit your website
- Other interests they may have
- Whether they’re new or returning users
Acquisition tells you how visitors found your website and where they came from. The information you’ll see covers:
- Whether they used a search engine to find your site (“organic search”)
- Whether they followed a link from another website to yours
- Whether they followed a link from a social media site (think Facebook or Instagram)
- Whether your visitors followed a link from your digital ad
Behavior documents how your website visitors move through the site to consume content. This category presents detailed information about:
- How many pages users visit on your site
- How much time they spend on each page
- Whether they left after a single page view (“bounce rate”)
- Which pages users landed on to enter the website
- Which pages users view and then leave the website (“exit rate”)
- The pages users interact with while on your site
- The most and least viewed pages
- The most common paths users take as they move through your site and where they drop off / or leave the website
When you think about it, that’s a great deal of information contained in just three categories. But how do you view and use all that data? It all begins with the date of the data.
Setting the Date Range
The default view is set to show you the data for the past seven days. It’s more helpful to see data over a longer period of time. So you’ll need to set a new date range. Let’s begin by clicking on Audience in the left side menu. Clicking the link reveals a dropdown menu. Click on Overview and the dashboard changes to reveal a snapshot view of the past week’s data.
Before you change the displayed date range in the top right section of the dashboard, you need to decide on the time period you want to analyze. You can choose a single month (September 1-31) or you can compare one month (September 2021) to the same month in the previous year (September 2020) to see year-over-year data. Or you can compare this month to last month. In other words, you can choose the time period to suit your needs. Google makes it easy to see the exact data in a time period that you need. Let’s set the date range for a week-over-week comparison. 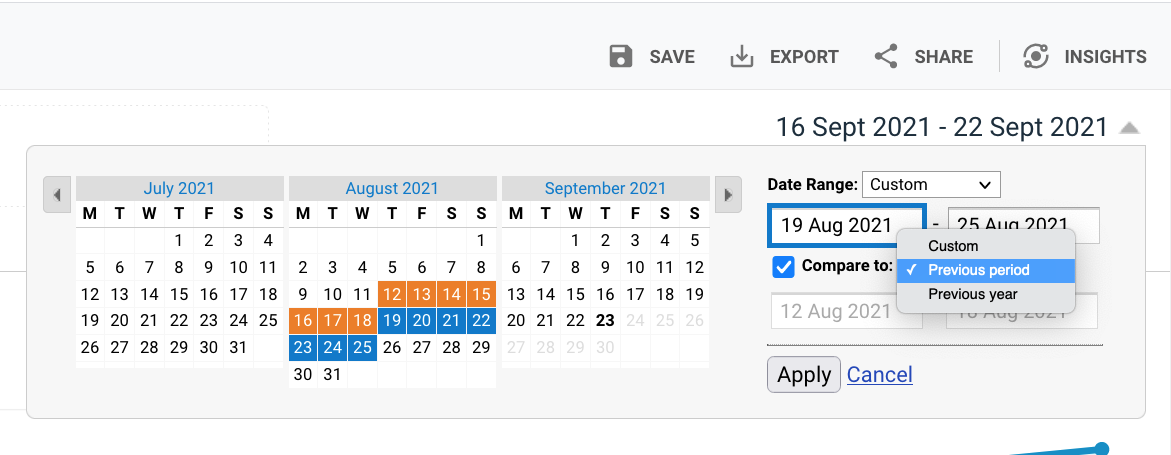 The Date Range should be set to “Custom.” Then click the date on the calendar you want to begin with; then click the end date on the calendar. Next, click the “Compare to” box and choose one of the three options. For this, I’ve selected “Previous Period.” Once you’ve made your choices, click Apply and Google will present the relevant data. Now let’s dive in to see what’s there.
Audience Metrics
Once you have set the date range for your specific time period, it’s time to look at the data. To keep things simple, I’ve chosen to look at a single week of data instead of week-over-week data.
The overview dashboard shows you the most important information in this section, which is true for all three of these categories. The Overview shows you:
- The number of users who visited your site within the time period
- The number of new vs. returning users
- The number of sessions visitors initiated (A session equals one visit. One user can be responsible for many sessions.)
- The number of sessions per user
- The total number of pageviews for your site
- The average number of pages viewed per session
- The average length of time for a session
- The bounce rate or single page visits (A user landed on a page and then left the site without visiting any other pages.)
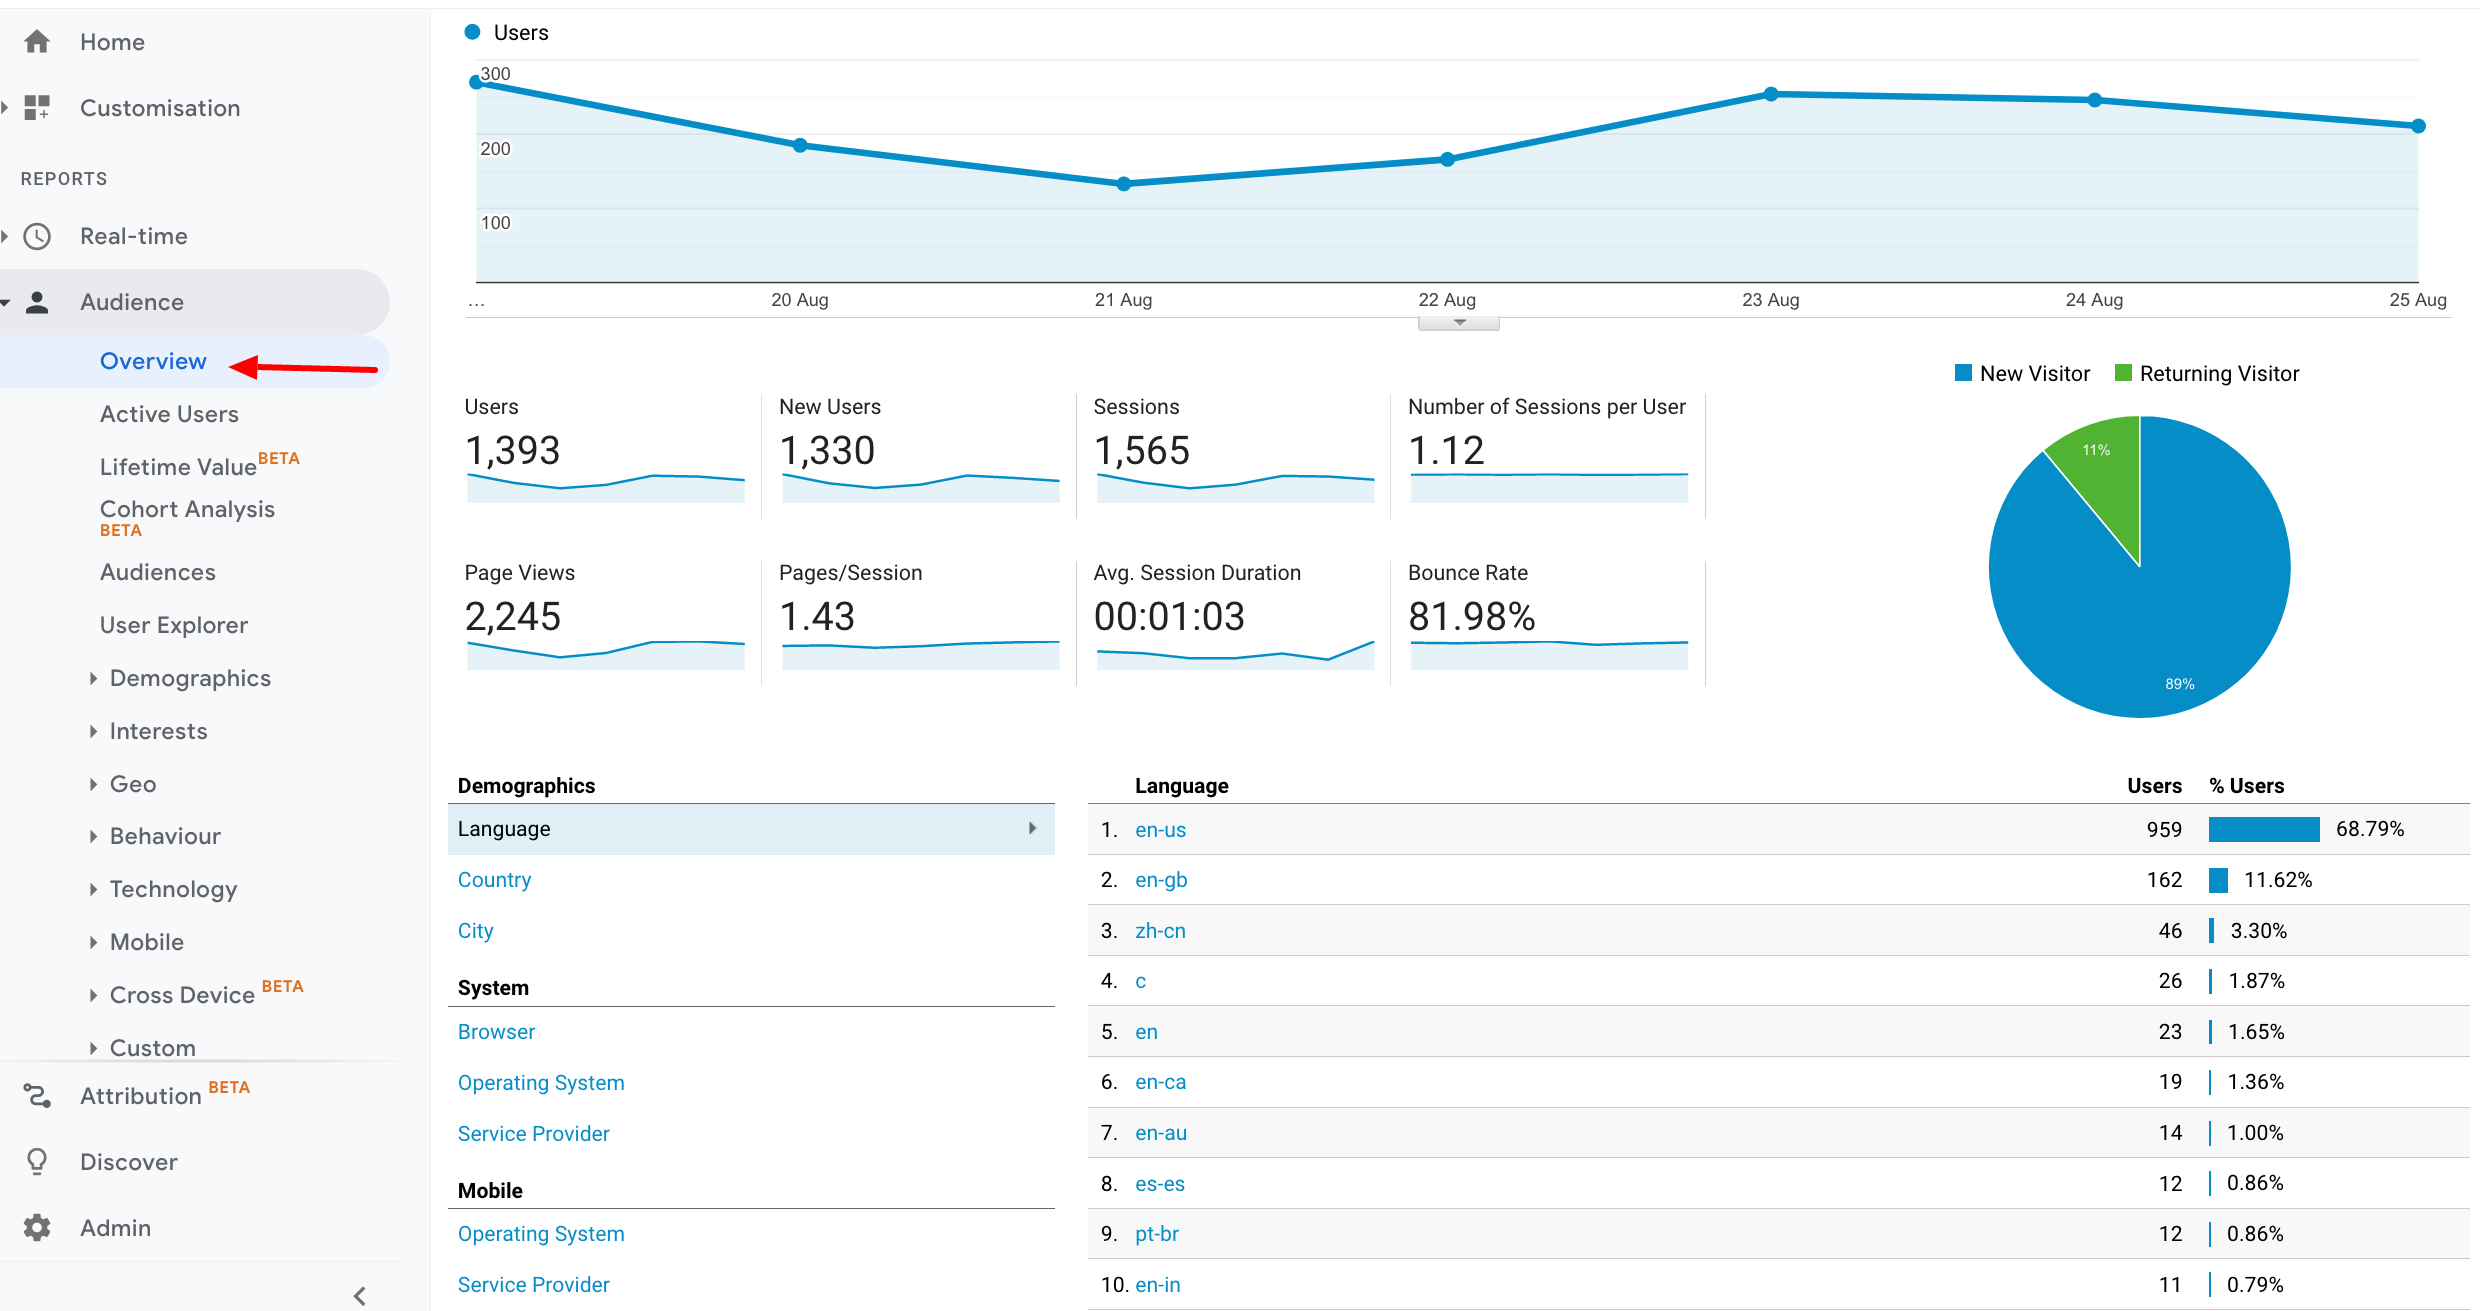
The other subcategories for the Audience category can provide insight into the gender and age of users (Demographics) and location and language (Geo).
The real gem is what you can do with this info. For example, are your users located where you think they are? At EVG, we have visitors from around the world since we’re a global company. But every website is accessible to a global audience. The location screen breaks down where your visitors are located.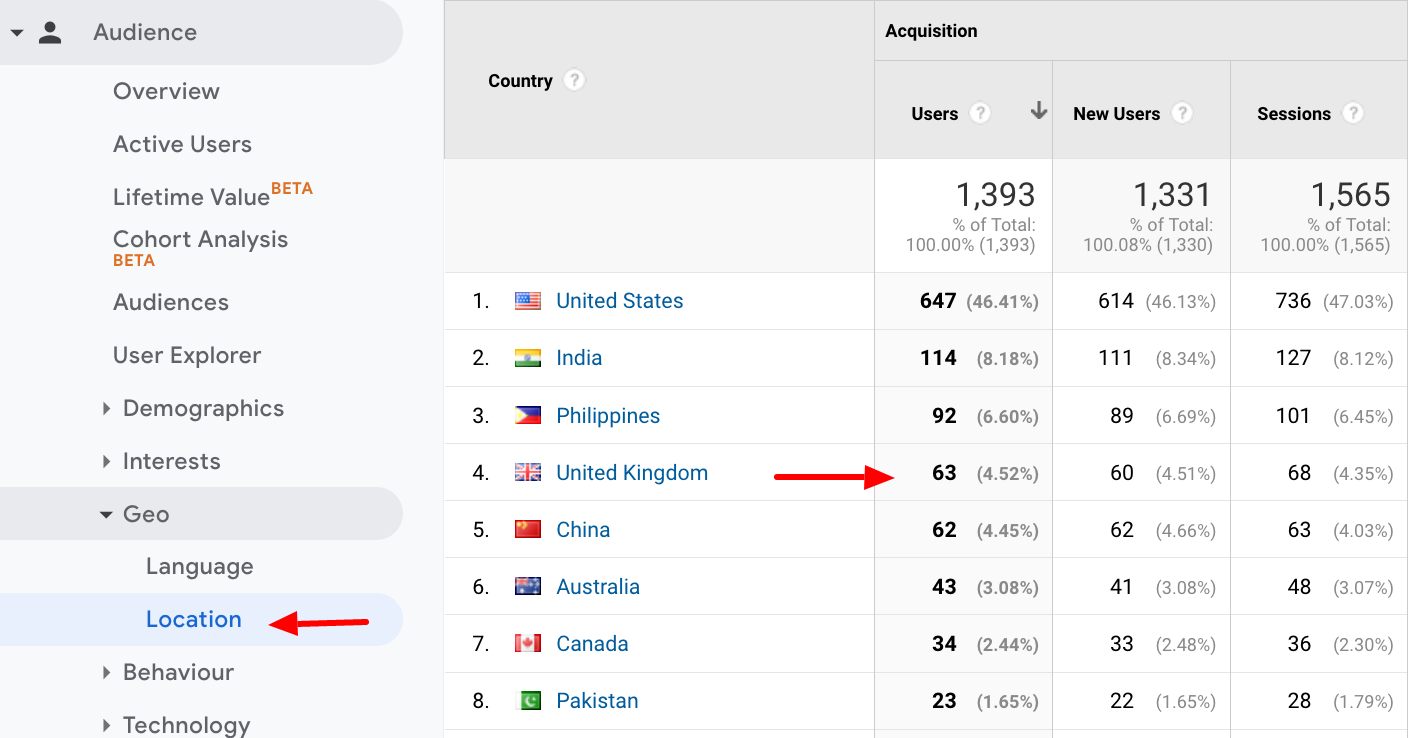
During one week in August, we had 63 visits (sessions) from users located in the UK. If I click on the UK link, I can see more information about the region they’re from. More importantly, I want to know what pages those UK visitors viewed. In order to do that, I need to set a secondary dimension to filter that data. I can do this by clicking on the Secondary Dimension menu. Scroll down to “Behavior” under More dimensions and choose “Page.” 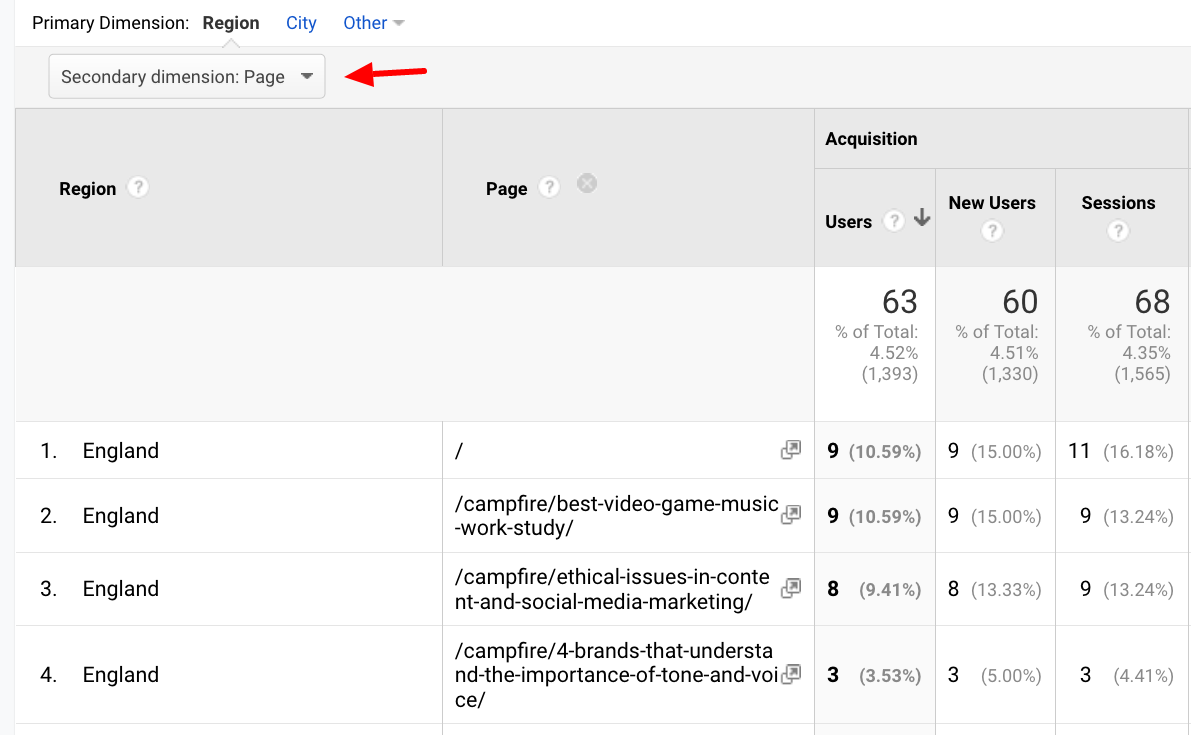
The results show that these UK visitors are consuming EVG’s blog content. My next step might be to compare that to previous time periods to see if the audience visits the blog or other pages. Those secondary dimensions can be used on any of the categories of data to learn more about your audience. But how do you acquire those visitors? That’s the third category we’ll examine.
Acquisition Data
If you’re a small business owner, growing your audience is important. You’re probably running ads, improving SEO on your website, and creating social media posts or newsletters to build an audience or drive brand awareness. The acquisition category is one way to measure how effective your efforts are to drive more traffic to the website.
As with the Audience category, the overview for acquisition presents a breakdown of where your site traffic comes from. In the example below, the majority of traffic to the EVG website is from users who followed an organic search results link. 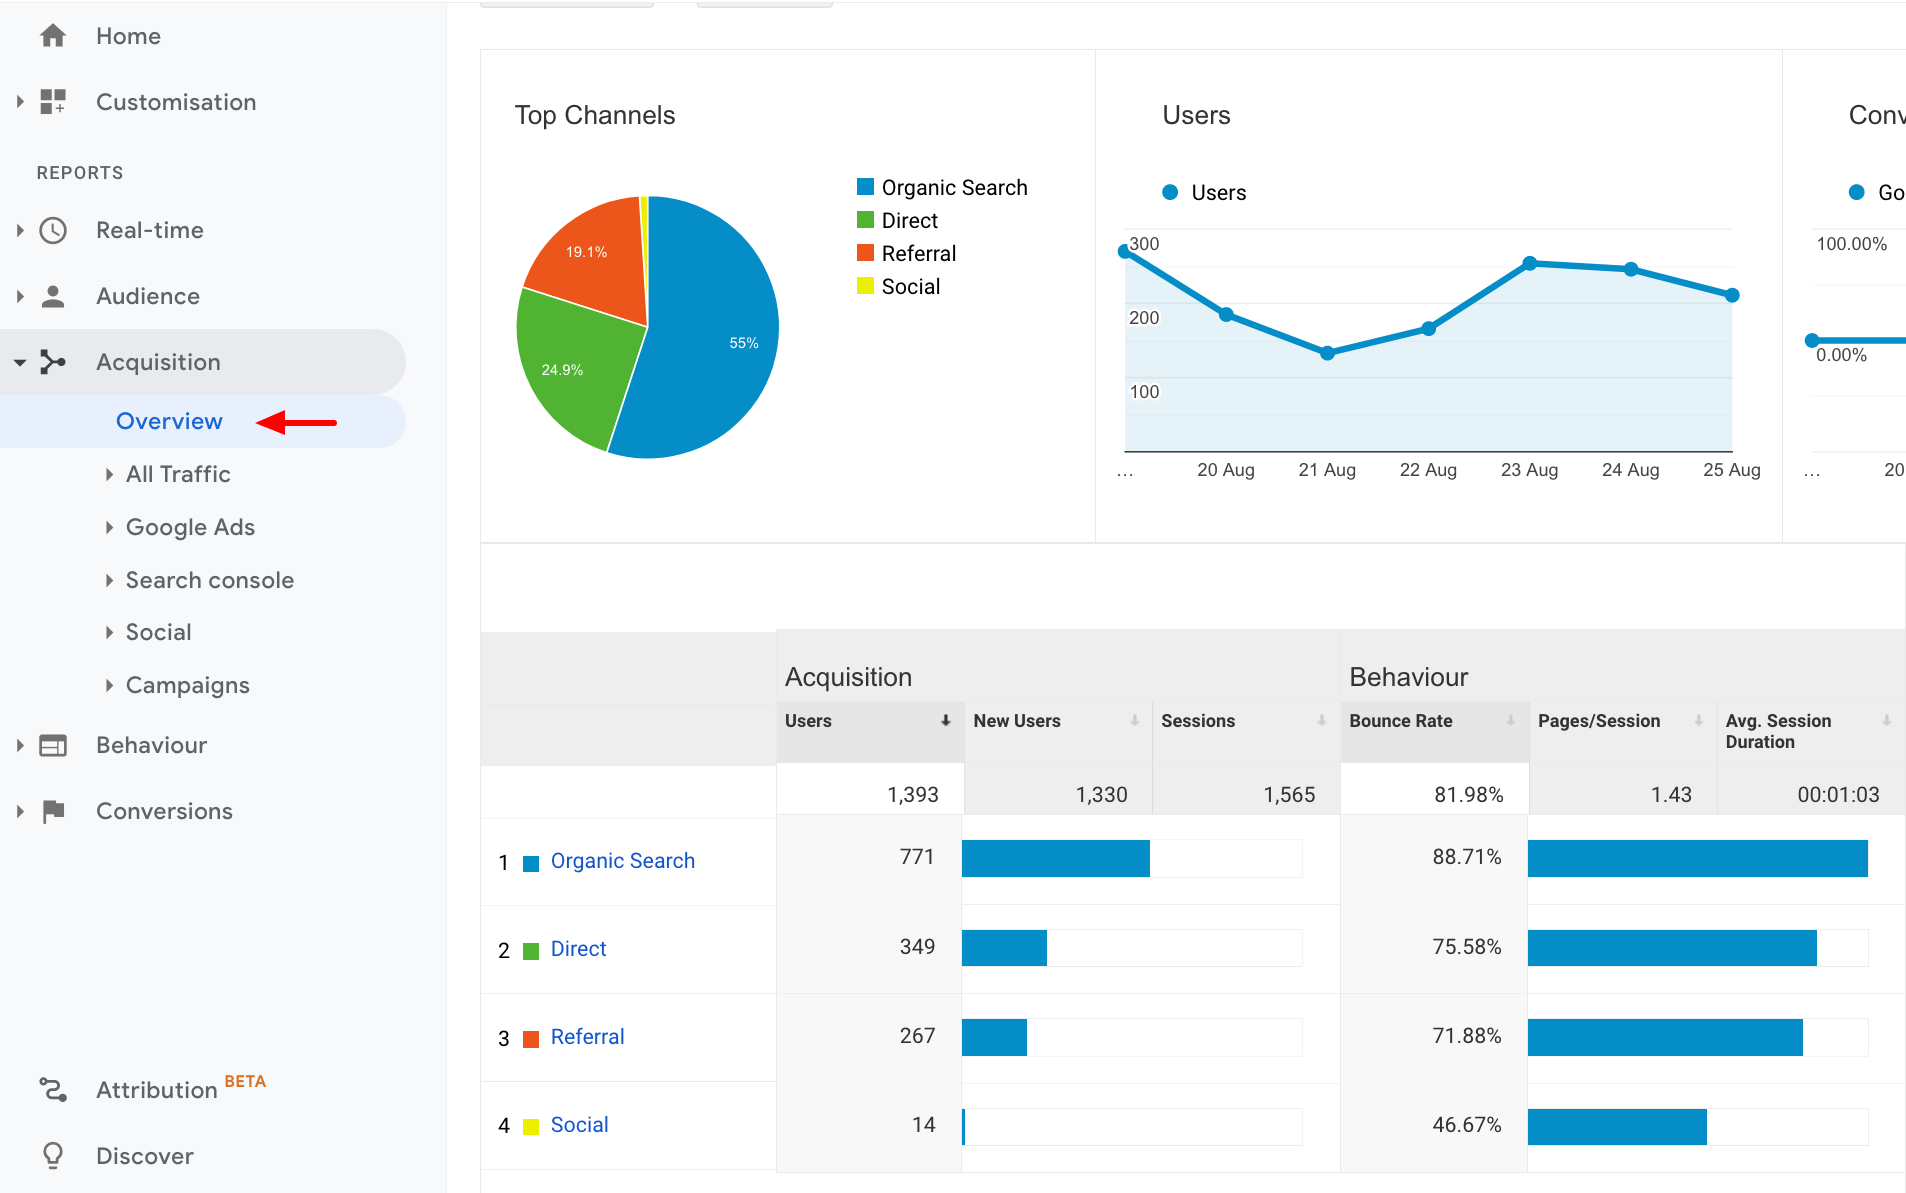
Organic search (not ads) accounts for 771 visits, or 55% of the site’s traffic during the week I’m reviewing. Direct visits (users typing in the URL or using a bookmark) are responsible for 349 visits, or 25% of the site’s traffic.
To see the specific sources of visitor traffic, click on the All Traffic link just below Overview in the left navigation menu, which will open a list of four options. Then click on the Source/Medium link (arrow) to see the specific sources. 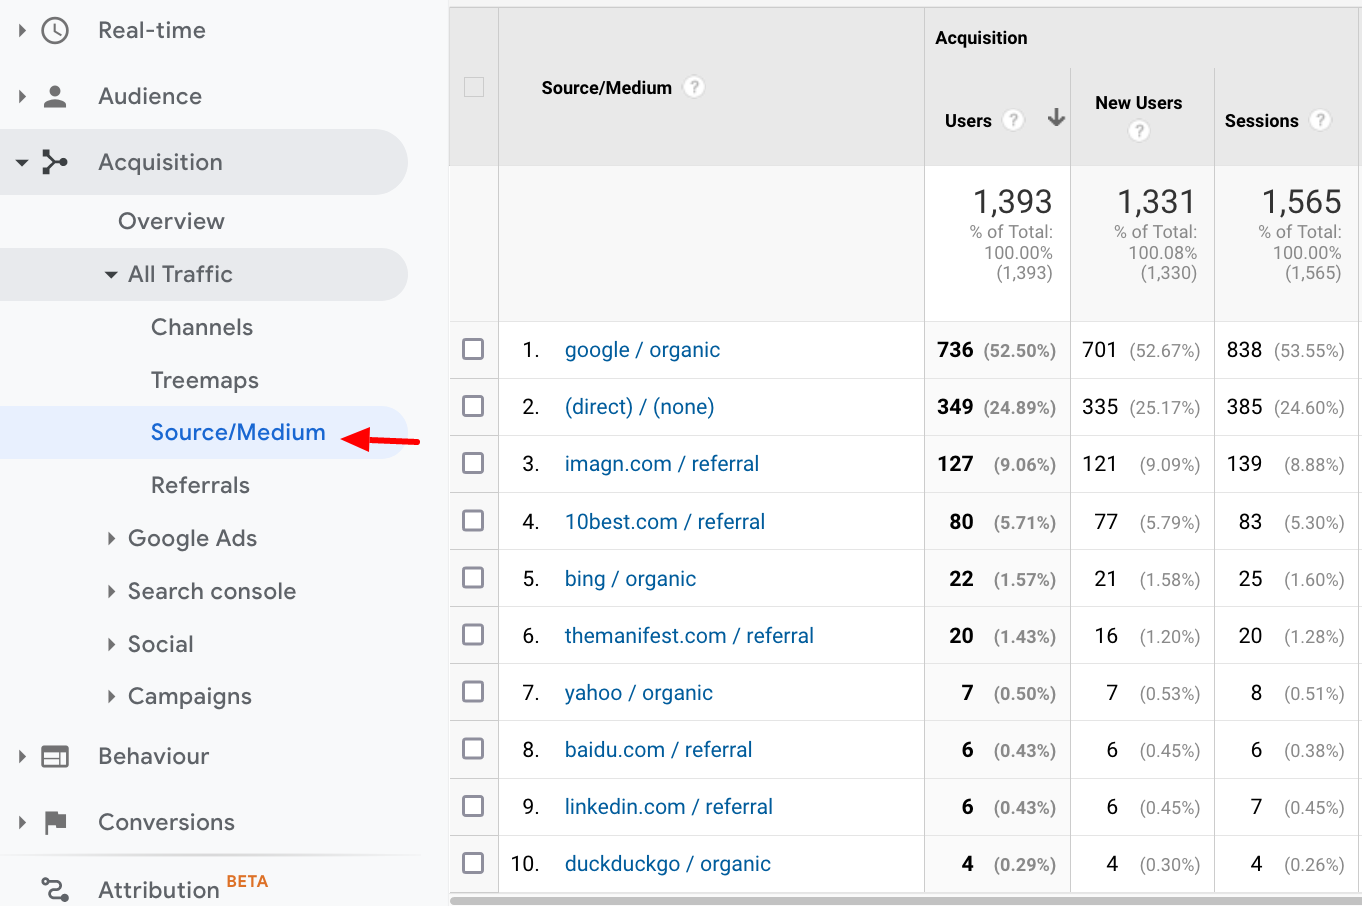
To find the specific websites your users came from, click the Referrals link instead.
You can use the Google Ads or Social sections of the menu in this category to see visits from those sites.
Why is this information useful? Seeing the hard numbers of who reached your site because of a digital ad, an organic search, or a link on another website helps you understand what’s working and what’s not working.
Understanding Your Audience’s Behavior
Last but not least, let’s talk about Behavior. Like the other two categories, the overview page gives you the most important details at a glance. Unless you’re publishing content daily or running an ad campaign, it’s easier to spot the trends by looking at data for a full month.
To go beyond this initial set of statistics, Click on Site Content in the left panel. It will reveal a sub-menu. Click on All Pages to see all your site’s pages in order of most viewed to least. The default setting is 10 entries, but if you have a site with many more pages, you can change the number at the bottom right of the page. 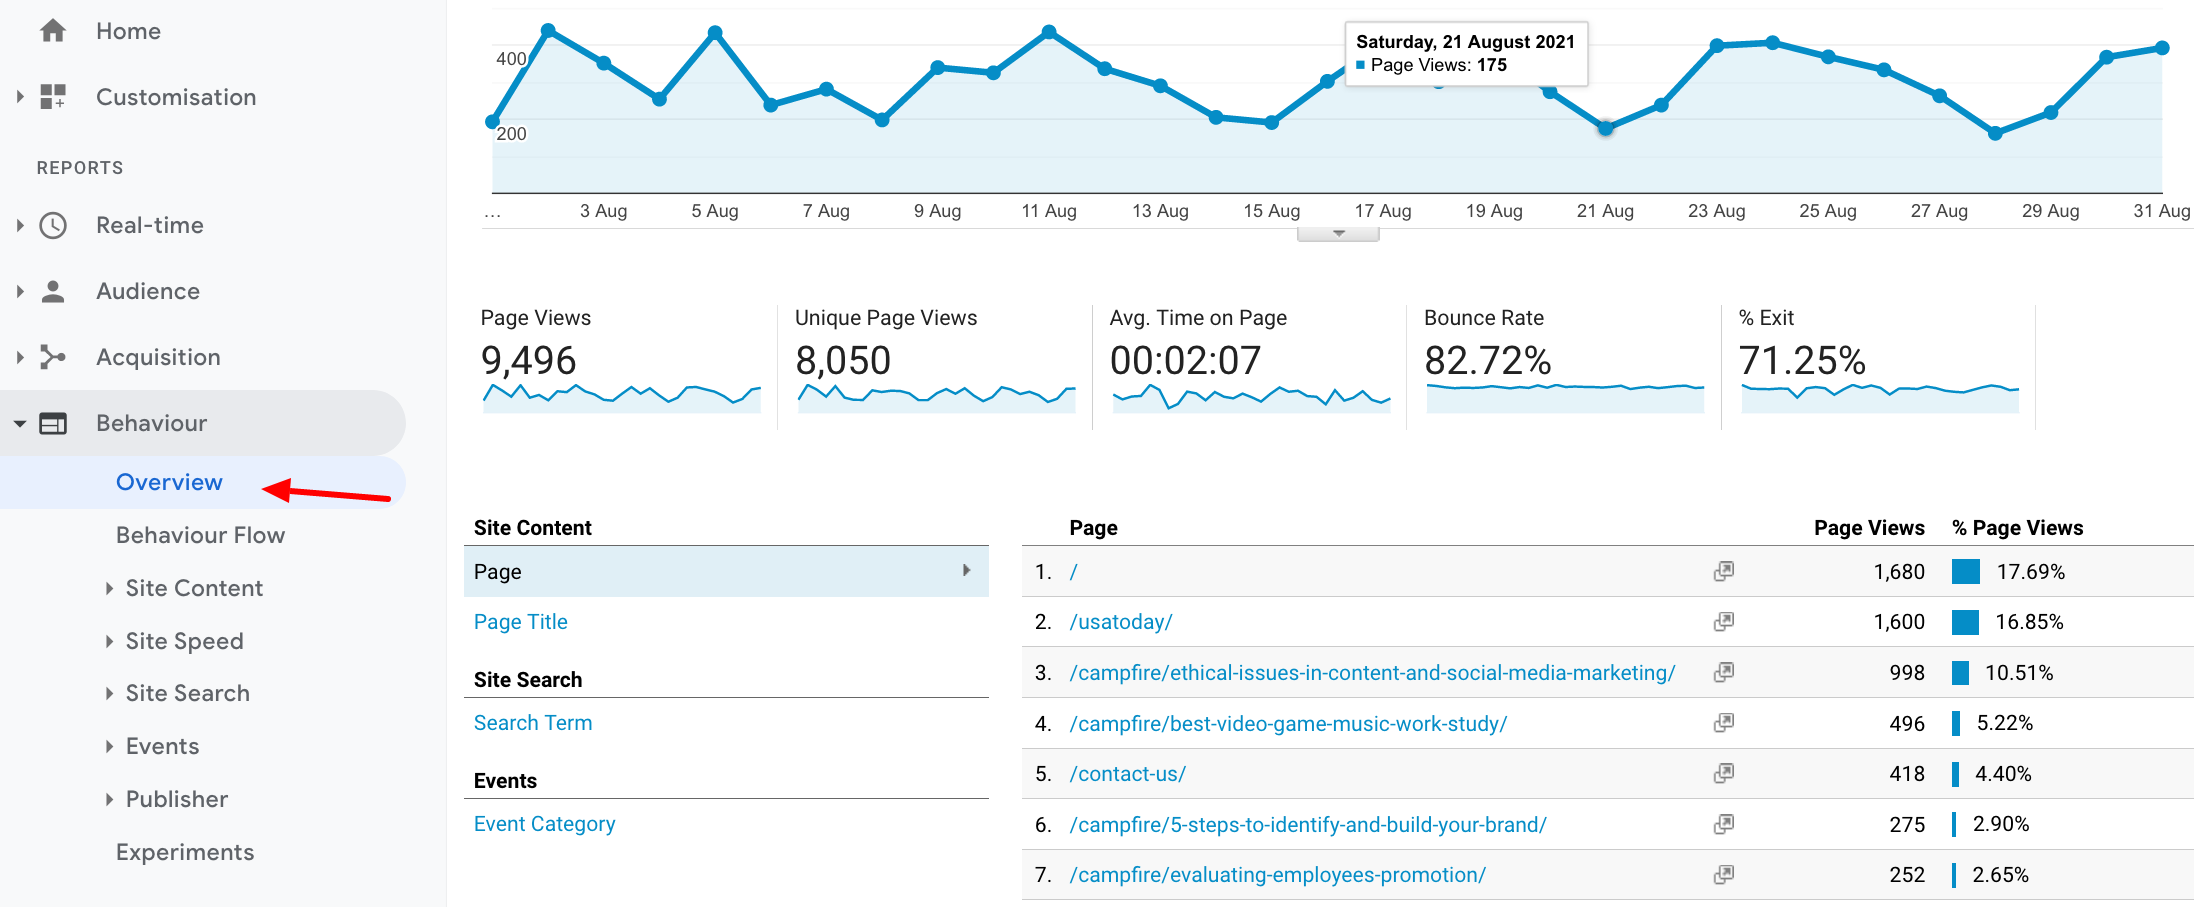
The first entry appears as “/” and that represents your Home page. (Everyone asks!) The data that you’ll see for each page includes:
- Pageviews counts the total number of pages that were viewed. So for each page, the pageviews number is how many times that page was viewed during the time period you set for the date range.
- Unique pageviews is how many of those pageviews were from a unique session.
- Average time on page tells you how long users typically stay on that page. If the page is a long article, an average time of seconds tells you people aren’t reading the content. Is it because the content is unappealing or wasn’t what they’re looking for?
- Entrances count how many times users entered the site through that specific page. This can signal the page answers a particular type of search. Why are they entering on THAT page? Are they moving on to other pages? Are they spending quality time on the page?
- Bounce rate is the percentage of users who leave the site after visiting this single page. You can use this to dig deeper to understand why they would leave the site after visiting this page. Are they not finding what they want? Is the page cluttered or confusing?Is the information outdated?
- % Exit is the percentage of users who leave the site from this page, regardless of how many pages they have already visited. If it’s a contact page, exits make sense. If it’s your home page, how can you make it stronger to encourage visitors to spend more time on the site?
To find out more about an individual page, click on the page you are interested in and then set a secondary dimension as explained above.
In the Behavior menu section, click the Site Speed link for data about your site speed. Site speed is an important signal for Google in the way it ranks sites for search results. By checking this data, you can see if you need to take actions to make your site load faster.
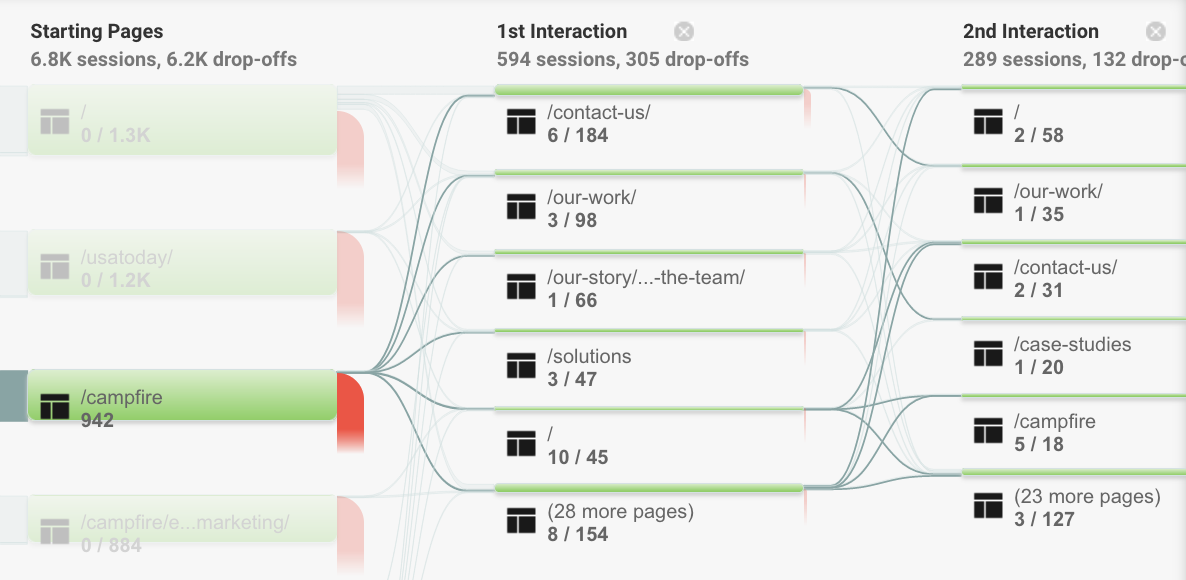
To learn how visitors are moving through your website, click on Behavior Flow. You’ll see a graphic interpretation of the common user journeys through your site. The key data is presented as the number of users who leave the site from a page and the sequence they follow through the website. (It’s rarely the path you think they should follow!) Click on any box in the flow chart and then click on one of the options presented in the drop-down menu to see more details about user actions. Just remember the “/” is the homepage.
The Right Data for Informed Decisions
With all the data available, you’ll be armed with the right information to make informed business decisions. Knowing who is visiting your site, what they’re doing, and where they came from provides insights you can use to create the right content for those visitors, make it more engaging to decrease exits and bounces, and increase time on page and pages viewed per session. You might consider translating specific pages of content into the languages of your visitors. Or maybe you need to improve your social media or Google Ads game.
If you’re looking for help to understand the data or to implement changes, the good news is that we do all of that. We’re happy to chat and answer your questions. We can offer you training sessions on Google Analytics or just about any other marketing topic. And if you’re pressed for time and resources, our team can manage the content creation process for you. Let us know what you’re interested in learning more about. I’d love the chance to speak with you about how EVG can help you meet your small business goals!
Laura Lee, SEO Director, Account Manager