Google Analytics for Busy Hotel Managers
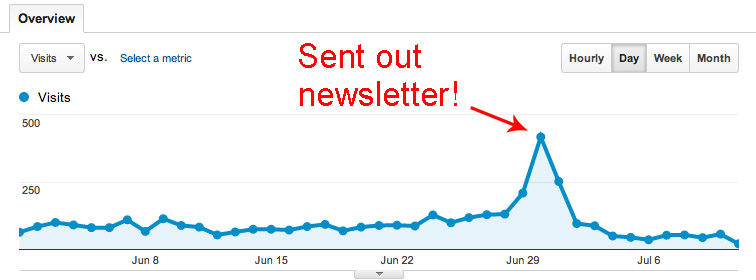
Meet John, general manager of the Scooby Woo hotel in London. Like many hotel managers, he has Google Analytics code on his hotel website, but doesn’t have the time to do anything but nod happily when the IT guy points out a spike in visitor numbers after an e-newsletter or promotion.
For John, website analytics is a technical subject best handled by the IT department. Plus, he reckons it’s only SEO people who need to crunch numbers. He’s focusing instead on a content marketing approach and has invested heavily in rewriting the website, building a hotel blog and creating some cool videos and photos to share on social media.
Trouble is, by ignoring analytics data John is basically ignoring what his customers are telling him.
- How can his marketing team create content that people like if they don’t know what people like?
- How can he tell whether his daily tweets are generating any bookings?
- How come online bookings aren’t increasing – why are people leaving before they hit “Book now”?
Let’s take John on a half-hour tour of his Google Analytics report and show him what he can do to attract more visitors, keep them engaged for longer and encourage them to book a room at his inn.
Where are they from?
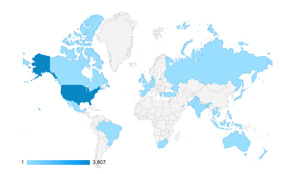
By reviewing his visitors’ top languages and countries month by month in All Visitors/Language and Location, John sees that French visitors are the biggest demographic after English. Plus, there is a significant increase in French visitors every year in the months leading up to June. Of course! The hotel’s right near Wimbledon and a lot of French people come for the tennis tournament.
A quick check of the Traffic Sources/Search page confirms this insight. He filters the keywords by country, and sees that the most popular keywords among French visitors in April and May are variations of “Londres hotel Wimbledon”.
Based on these numbers, John decides he might localize the main pages of his website in French. He also creates a “Wimbledon” package aimed at French visitors including a four-night stay, tickets to the tournament, pick-up from the Eurostar terminal and a cream tea. He’ll push this package on his website and social media – including French social media – next spring.
Social sources
Next, John checks out how his social media efforts are working out in Traffic Sources/Social. He’s shocked to discover that Twitter generated only 2.1% of visits to the website in the last month, despite his marketing manager spending half an hour each morning tweeting about deals. On the other hand, it looks like Facebook is consistently bringing in some 40% of visits, and that visitor numbers from Google+ are growing each month.
Drop Twitter, he tells the marketing manager. Focus on maintaining and strengthening the Facebook community, and on enhancing Google+ since there’s clearly some potential there.
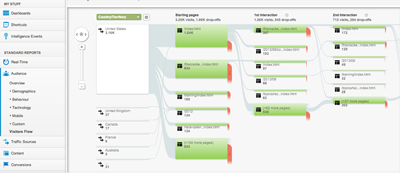
By checking out the Social/Visitors Flow tab, John also sees that visitors who land on blog pages tend to drop off without going further into the site. He looks at Audience/Visitors Flow and sees that indeed, people who visit the home page first tend to visit several pages more and often end up booking, whereas those who land on the blog just disappear. Delving deeper, he goes to Content/Exit Pages, which shows the last page visitors look at before saying goodbye. Yes, blog readers are being lost before they even see the main site.
He goes to his blog and realizes that the link to the main website and booking page is very difficult to find – hidden away at the bottom of the page in a sidebar. With a few tweaks of the design, he can bring it right up to the top where it’s visible. He also decides to put a few deals in the sidebar to encourage click-throughs to the main site.
Mobile first

John looks at the Audience/Mobile tab and – wow – 34% of visitors to his website last month were using a cellphone or tablet, up from 15% in the same month last year. Back in Audience/Visitors Flow, he filters the graphic by “Mobile”. The majority of mobile users have been dropping off without going further than their landing page, and very few have clicked on the booking page.
Why is this? John gets out his mobile and takes a peek. It takes him 15 seconds to open the home page on account of the heavy graphics and embedded video. Then he tries to use the booking form, but he keeps pressing the wrong button by mistake and gives up, frustrated.
It’s time to get serious about creating a mobile-friendly website, John decides, getting rid of heavy graphics and installing mobile-friendly booking forms and simple navigation. He had read about the rise in mobile devices before, but hadn’t really thought it applied to him. It took the analytics data to make John realize how many potential customers he was losing by not optimizing his website for mobile.
Who’s sending guests to you?
The half-hour is nearly up, but John heads quickly to Traffic Sources/Sources/Referrals. There he sees that Tripadvisor is sending 68% of referred traffic his way. He pops over to his Tripadvisor page and sees a bunch of new reviews, mostly positive but several mentioning the difficulty in finding parking at or near the hotel.
John recognizes two things from this. First, the importance of Tripadvisor – so he makes a note to enhance the profile, upload new photos and reply to guest comments.
Second, that analyzing Tripadvisor reviews is as important as analyzing Google’s numbers and pie charts. If people are interested in parking, he’d better give them what they want. So he sets up a deal with a local car park to offer discounted parking to hotel guests and adds this valuable information to his website.
Half an hour spent, hours and $$$ gained
In half an hour, John has gained some incredibly valuable insights – insights that will enable him to vastly improve the content and design of his website, as well as what he can offer his customers in real life.
Whether these actions lead to conversions is something he can track with some of Google Analytics’ more sophisticated tools, including:
- Goals: to measure conversions
- Events: to track the number of specific events, e.g. downloads, video views
- Custom Campaigns: to add tracking tags to links in social media campaigns and e-newsletters
- Multi-Channel Funnels: to measure the number of interactions and days it takes a customer to convert
It doesn’t matter if you’re the head of Fairmont or have a three-room B&B by the beach in Rhode Island. You can still, like John, use analytics data to improve your customer’s experience as well as your conversion rates.
For more inspiration, see some of Google’s own case studies. And check out EVG’s Slideshare presentation comparing Google Analytics & Omniture: What they can do for you.
Monica G. – Content Strategist